Builds

Operations, Finance & Administration

Courtney Leung

Operations and finance systems, built from the ground up.

Designed and executed end-to-end operations and finance systems from scratch as the 5th employee at Isara Laboratories, an OpenAI-backed AI neolab that recently raised $94M, scaling the team from 4 → 20+ people across the US and Europe in under a year.

Before Isara, I spent a year at PwC doing financial statement audits for large healthcare, university, and biotech clients in the Bay Area.

Courtney Leung

This portfolio documents the systems and financial tools I developed at Isara, along with the reasoning behind how each one was designed.

Names, employee data, and specific figures have been anonymized for confidentiality.

About me

I started my career as an Associate at PwC doing financial statement audits for UCSF Health, Stanford University, and various biotech companies in the Bay Area. My work there covered the full audit cycle: substantive testing across revenue, inventory, fixed assets, controls walkthroughs, third-party confirmations, and tying out financial statements. Clients ranged from hundreds of millions to billions in annual revenue. It showed me how organizations run their finances, where the risks sit, where controls are needed, and how management decisions impact the books.

In 2025, the co-founder of Isara Laboratories reached out to me. We'd run a club together at UCSB and he'd seen firsthand my strengths in building organizational structure and taking initiative. When his startup started to grow and needed someone to own the operational side, he called me. I joined as Executive Administrator and built their operational systems from the ground up. Isara has since raised $94M, with OpenAI among its backers.

These are the systems and tools I built at Isara.
Skills & Tools

Operations
Onboarding Systems Vendor Management HR/Payroll Administration SOP Development Executive Support Calendar Coordination
Tools
Gusto Playroll Notion Google Workspace Microsoft Excel Vercel Claude Code Google Apps Script Ashby Slack
Finance & Compliance
GAAP Internal Controls Financial Reporting Regulatory Compliance

01 GiveTrack

Every two weeks, someone had to manually collect donation preferences over Slack with no way to track submissions or donation history. I built GiveTrack to automate the collection, log every submission, and give the team visibility into what had been donated and when.

I built a website after noticing a gap in how our company's charitable giving initiative was operating. Employees were allocated a giving budget each pay cycle with no centralized way to submit preferences, track payment status, or see their history. It was being managed through Slack threads and manually reconciled in a spreadsheet. I saw that there was space and need for automation, so I built a website and onboarded the team.

GiveTrack is a full-stack React app: custom UI, Google Sheets as a lightweight data layer, Vercel serverless API routes, and an admin portal with role-based access. I don't have a software development background, but as AI coding tools have made software development more accessible, I've developed strong skills building with them. I designed and built GiveTrack myself using those tools.

Before launch, I worked with our head of security to review the codebase and tighten access controls. Domain-restricted auth, least-privilege admin roles, audit logging, and server-side validation on sensitive actions were all scoped in from the beginning.

Relevant Tools
React Vite Google OAuth Google Sheets API Vercel Serverless Google Apps Script
Live Demo

This is a sandbox version of GiveTrack running on dummy data. To explore the app, click Sign in with Google and select the pre-filled @company.co test account. No real credentials needed.

View GiveTrack →
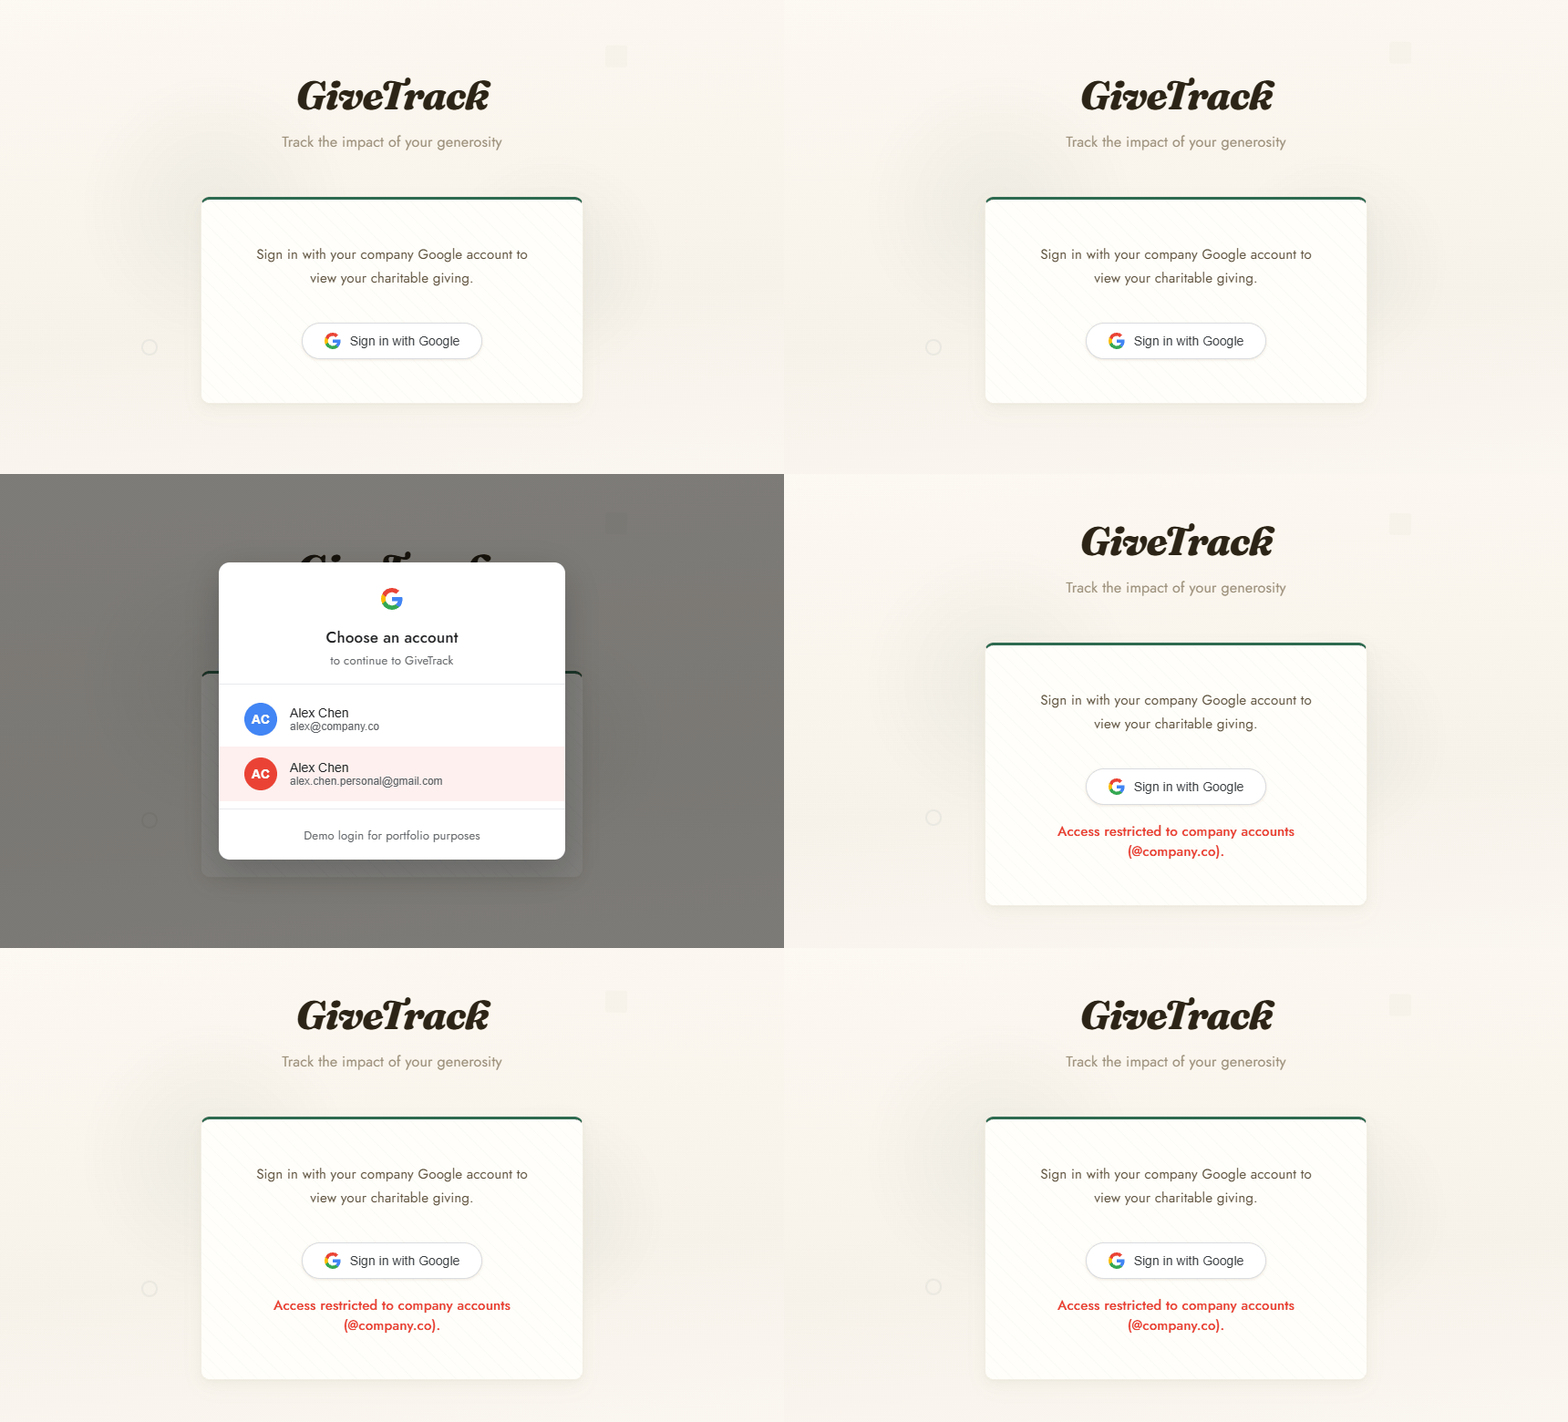
GiveTrack sign-in flow showing domain restriction
Access Control
Company accounts only: personal Gmail blocked at the gate

Sign-in runs through Google OAuth locked to the company's Workspace domain. Any account outside the domain is rejected before a session is created. When someone's Workspace account is deprovisioned, their access is revoked automatically.

Employee Dashboard
Total Impact Landing Page

After signing in, employees see a summary of their cumulative giving: total donated, organizations supported, countries reached, and months active. Data is pulled from Google Sheets via the Sheets API and cached in-memory. The ops team can see and edit the raw data directly in the spreadsheet.

Giving Workflow
Percentage-based allocations per pay cycle

Each pay cycle, employees split their giving budget across organizations by percentage. Allocations from the previous cycle carry forward automatically, so employees who give the same way every month just confirm and submit. Each submission is stored per cycle so the full history is preserved.

Organizations
Your Charities

The Organizations tab shows every charity an employee has given to, with the cause area, total contributed, how many teammates also support it, and a link to the charity's website. Logos are fetched and cached client-side with an initials fallback if none is found.

Giving History
Cycle summary and history

The Monthly tab shows giving history by pay cycle with a donut chart showing how the budget was split each month. Payment status is visible at the cycle level and gets updated by the admin team once payments go out.

Team View
Giving as a collective

The Team tab shows the company's collective giving total: dollars donated, organizations supported, and cause areas covered. I added this so employees could see what organizations their teammates were supporting and discover causes they might not have considered on their own.

Global Impact
Your reach modelled

The Impact tab shows a 3D globe with markers on the countries where supported organizations operate. Each point is clickable and breaks down the top organizations supported in that location. For a giving program, making geographic reach visible makes collective impact tangible. It's a feature designed to encourage participation. It's built with react-globe.gl and lazy-loaded so the dependency only fetches when the tab is opened. The globe updates automatically as new organizations are added.

Admin Portal
Full payment workflow with role-based access

The admin portal is only visible to accounts hardcoded in the codebase at build time. There are two access levels: viewers (read-only) and editors (can mark payments, log receipts, and export CSVs). The tracker shows all employee submissions for the current cycle, and admins can mark items as paid, log the date, and attach receipt evidence. The full cycle management lives in this centralized website.

Data flow

The frontend calls the Apps Script Web App directly. Every request sends the user's Google ID token, which Apps Script verifies before touching any data. There is no separate proxy layer; Apps Script is the backend.

A separate Vercel serverless function reads payment totals from a SharePoint Excel file maintained by finance, via Microsoft Graph API. Pulling from finance's source directly meant GiveTrack and finance always showed the same numbers. Credentials live as Vercel environment variables, never in the client.

Auth model

Every request requires a valid @company.co Google ID token, not just the initial login. If the token is missing, expired, or from the wrong domain, the request is rejected before any data is touched. Removing someone from Google Workspace revokes their access immediately.

Write locking

Google Sheets has no native transaction system. Every POST acquires a script lock via LockService.getScriptLock(): if two employees submit at the same time, one waits up to 10 seconds, and if the lock can't be acquired it returns an error rather than risking a corrupted write. This ensures concurrent submissions queue cleanly rather than corrupting each other's writes.

Admin roles

Two tiers: Level 1 can manage featured organizations, Level 2 can write budgets, pay cycles, and the admin list itself. Bootstrap admins are hardcoded in Apps Script as a safety net. A Level 2 admin can update the list through the app without redeployment.

Audit logging

Every write, including denied ones, appends a row to a dedicated AuditLog sheet tab with the timestamp, email, action type, and payload. The log is append-only with no delete permissions. If someone attempts a write they don't have access to, that attempt is recorded too.

Security considerations

Apps Script verifies the JWT's issuer, expiry, and domain but does not cryptographically verify the signature. For a public-facing API this would be a gap. For our domain-restricted internal tool with a controlled token origin, it's a deliberate tradeoff that was reviewed with security.

02 API Credit Tracker

Our teams needed a clear view of API cost, runway, and budget allocation, so I built a dashboard tailored to each audience: finance, engineering, and leadership.

The team received an LLM credit grant to work with, which was booked as a prepaid asset. The provider's dashboard shows usage by model and project, but it wasn't built with finance teams or executives in mind. Three different groups needed visibility into the same data for different reasons: finance needed expense figures and accounting entries, executives needed runway projections, and engineers needed to see their own usage and cost attribution. I connected to the OpenAI API and built a single dashboard that consolidated all of it in one place.

Relevant Tools
Next.js 14 React Tailwind CSS OpenAI API Google OAuth Recharts TypeScript
Portfolio Demo

Sandbox version running on dummy data. Sign in with the pre-filled @company.co Google account. No real credentials needed.

Open Demo →
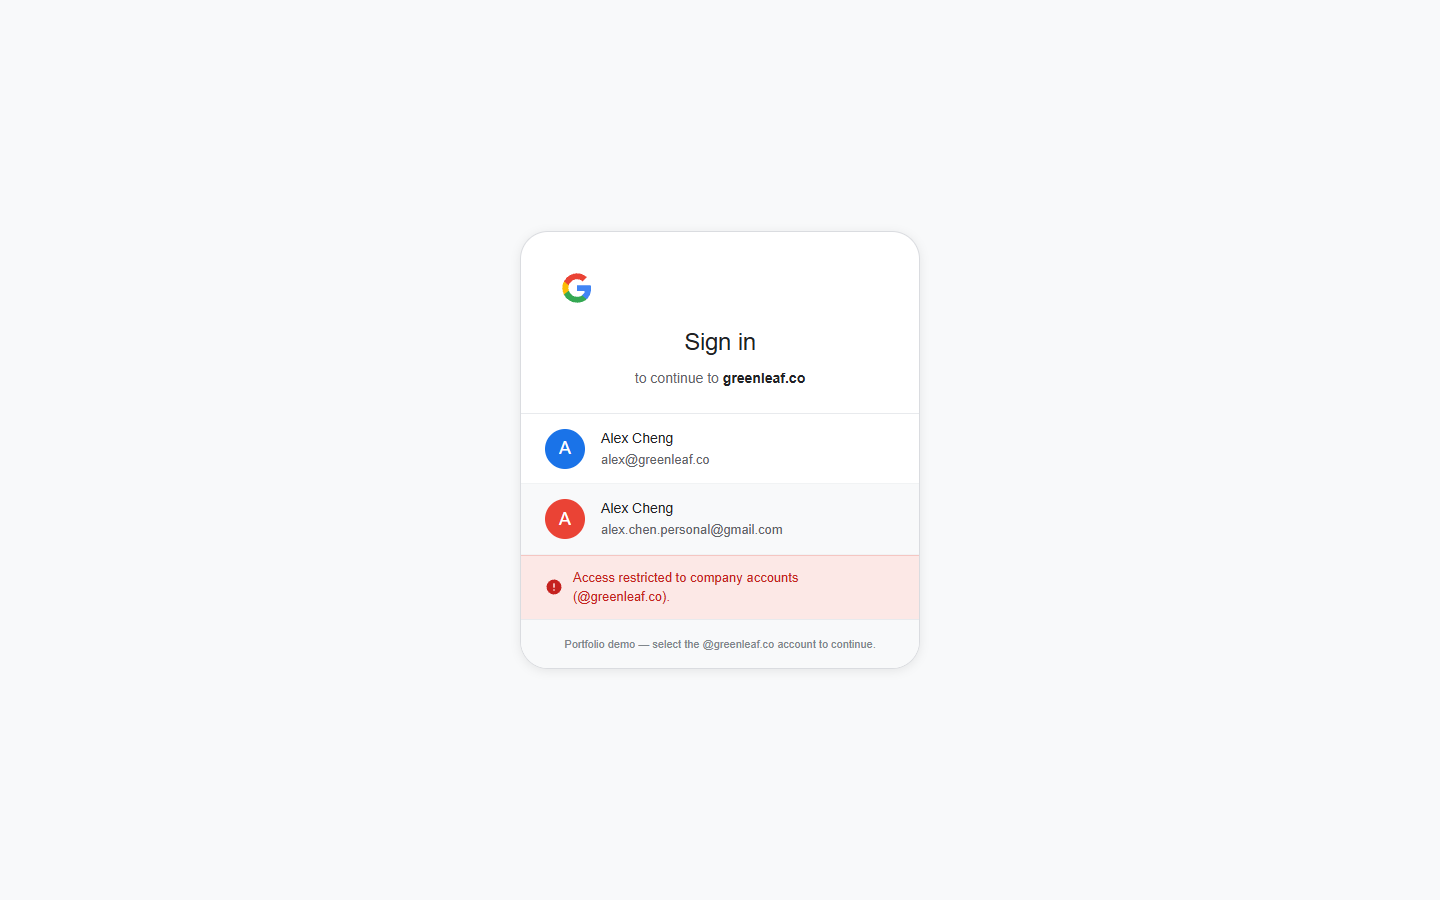
Access denied for personal account
Access Control
Same auth pattern as GiveTrack: Workspace accounts only

Uses the same domain-restricted Google OAuth model as GiveTrack. The dashboard surfaces financial data (credit spend, runway projections, and accounting entries) that shouldn't be accessible outside the company. Any account outside the Workspace domain is rejected before a session is created, and deprovisioning a Workspace account revokes access automatically.

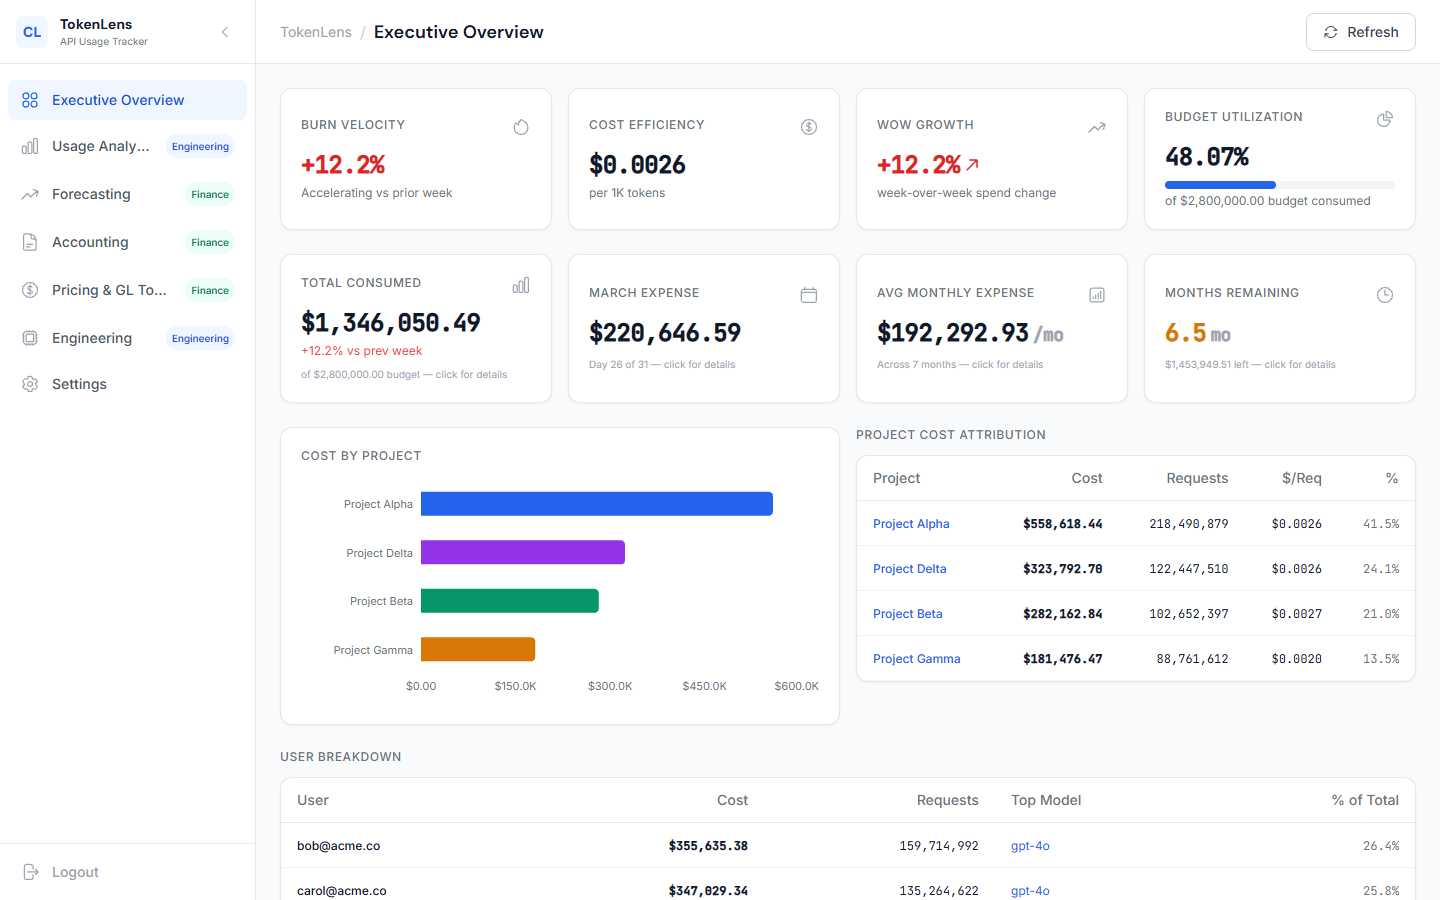
Executive overview dashboard
Executive Overview
Credit balance, burn rate, and runway at a glance

The main dashboard shows current credit balance, daily burn rate, burn velocity (recent 7-day average vs. prior 7-day), cost per 1,000 tokens, and projected months remaining. Spend is broken down by project and model, with a per-user attribution table showing request counts and primary model. A daily cost chart flags anomalies inline, each stat card opens a step-by-step proof modal, and monthly summaries can be exported as CSV or PDF.

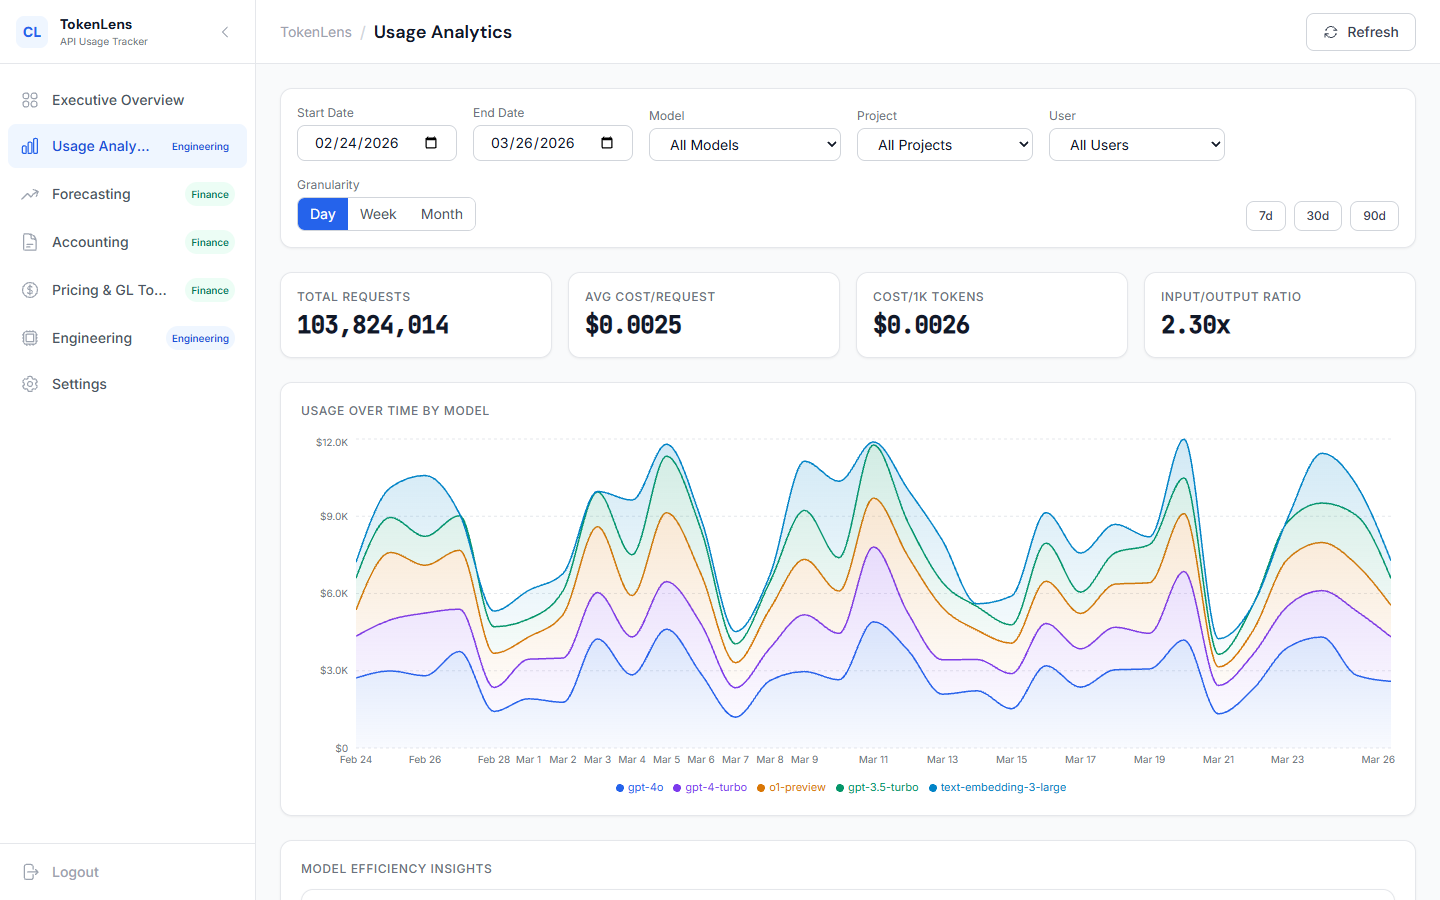
Usage analytics view
Usage Analytics
Model-by-model cost breakdown over time

Filters token-level consumption by date range, model, project, user, and granularity (day, week, or month). A stacked bar chart shows each model's cost share over the selected period, and the efficiency table reports cost per 1,000 tokens and input-to-output ratio for spotting prompt bloat. This was the view that surfaced when a project quietly switched to a more expensive model without a clear reason.

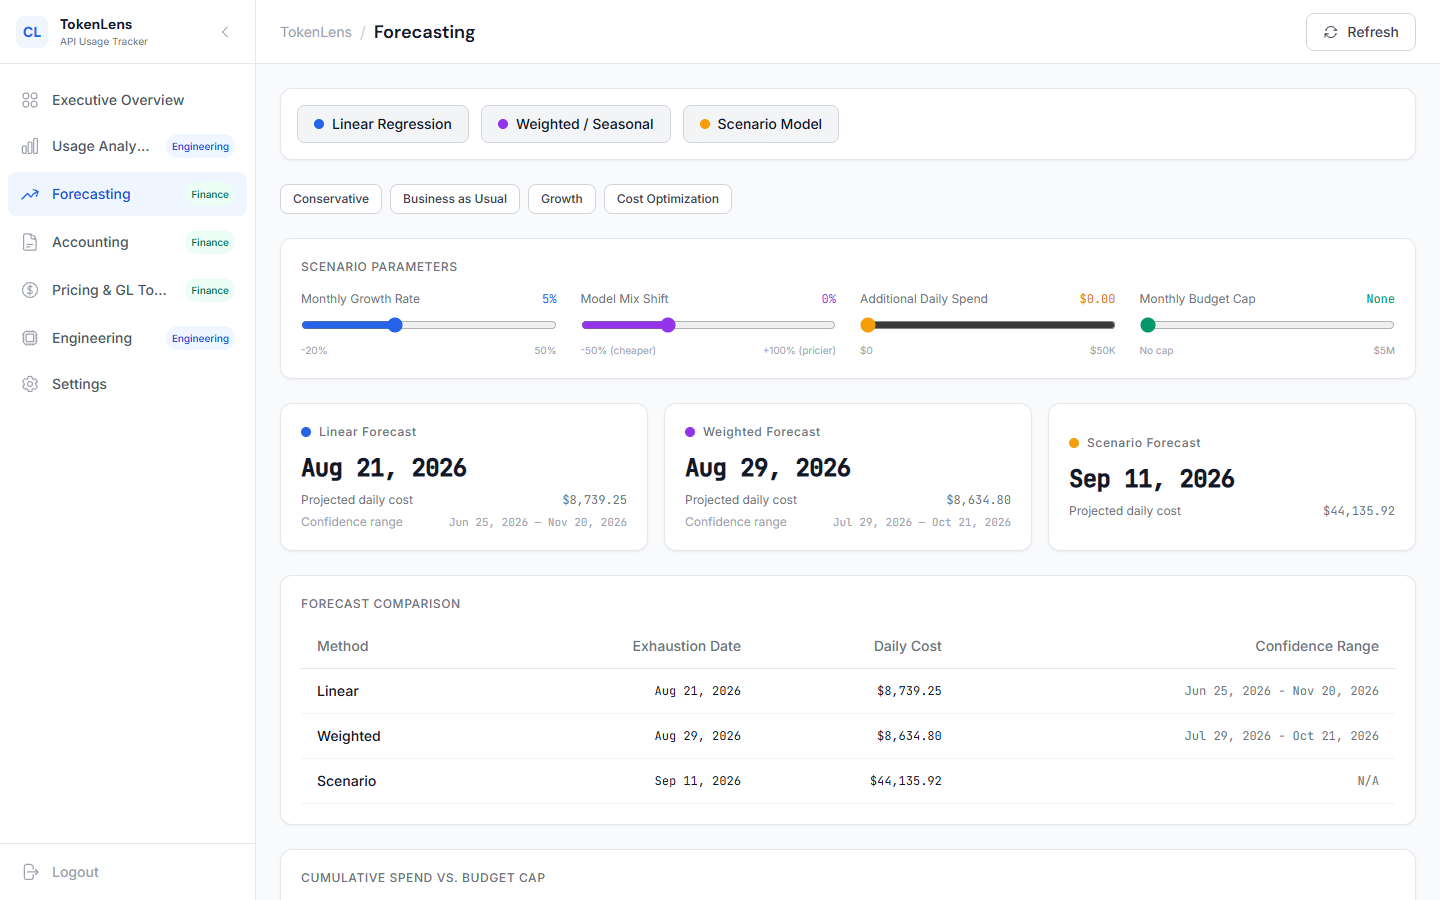
Forecasting view
Forecasting
Budget runway based on recent burn rate

Projects when the credit balance will run out based on current burn, with three independent models so the answer isn't dependent on any single method: a linear regression on historical daily costs, an exponential smoothing model that accounts for day-of-week patterns and recent growth trends, and a configurable scenario model. The scenario model accepts parameters for monthly growth rate, model mix shift, additional daily spend, and a monthly budget cap, with presets for Conservative, Growth, and Cost Optimization. All three are plotted on a cumulative spend chart against the budget ceiling, and each includes a step-by-step proof of how the exhaustion date was calculated.

Accounting view
Accounting
A reporting view finance could work from directly

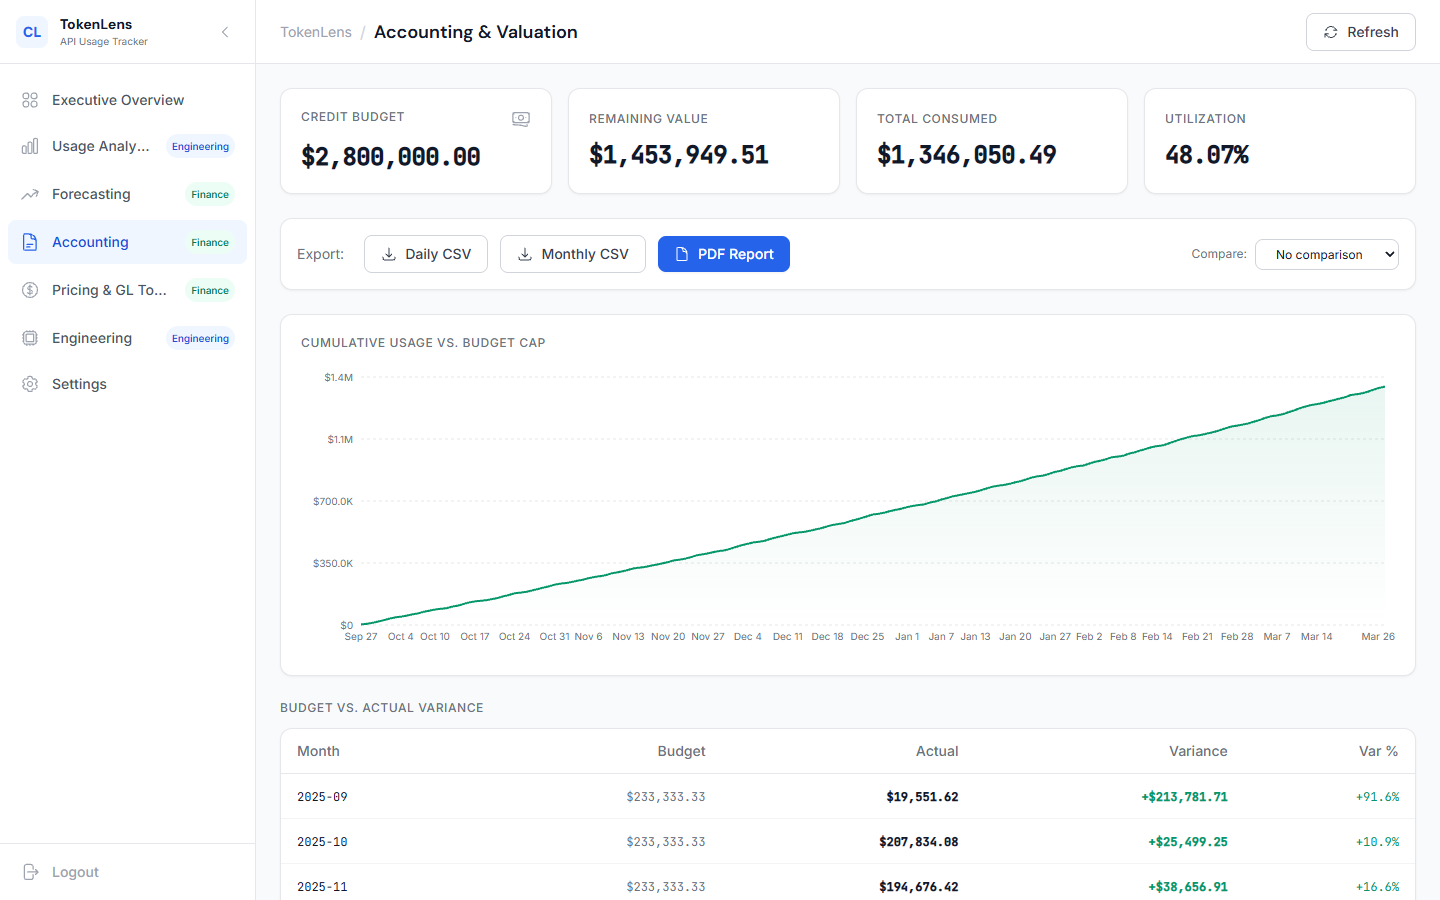
Built around the credit grant being carried as a prepaid asset. It generates double-entry journal entries per month (DR: AI Research Expense / CR: Prepaid OpenAI Credits), tracks budget vs. actual variance, and plots cumulative spend against the budget ceiling. A post-credit cash flow projection estimates monthly operating expense once the balance is exhausted, and cost is broken down by project for internal chargeback. Exportable as a GL-ready CSV, monthly summary CSV, or PDF.

03 Employee Onboarding System

When I joined, there was no onboarding process. I was added to tools and systems reactively, as gaps came up. I built a system where every step is sequenced around dependencies, documented to the detail, and runs the same way every time, regardless of who's running it.

That experience was the baseline I used to build something better. I mapped out every dependency, sequenced the steps, and turned it into a repeatable process built around getting new hires productive as fast as possible.

Before → After
Before
  • Steps lived in scattered Slack threads and manager memory
  • No consistent process across departments or employee types
  • Tool access provisioned reactively, often mid-first-week
  • New hires had no visibility into what to expect or when
  • "How things work" required asking the right person
After
  • 7-phase process from pre-arrival through first 5 days
  • One consistent experience regardless of role or track
  • Access provisioned before day 1 from a role-based checklist
  • New hires have a clear roadmap from offer acceptance onward
  • Any ops team member can run it without asking anyone
Tools provisioned on day 1
GustoGoogle Workspace1PasswordSlackNotionRampFigmaGitHubHuman InterestCursor

Everyone at Isara coded to some degree — automating workflows was part of the culture across all roles, including ops.

How I built it
  1. Mapped the current state. Used my own onboarding experience as the baseline and identified how to turn what I went through into a repeatable workflow.
  2. Identified dependencies. Figured out the order things had to happen in based on access and structured the phases around those dependencies.
  3. Designed for two tracks. Built separate paths for FTEs and contractors since their requirements and timelines are different, with shared phases where the process was the same for both.
  4. Piloted on real hires. Ran it on three live hires before finalizing anything, noted where things slowed down, and revised based on what I saw.
  5. Built for handoff. Documented every step and decision so anyone on the ops team could run it without needing to track down whoever built it.
Selected design decisions
Why 7 phases instead of a flat checklist?
I used phases because a flat list doesn't show what has to come before what, or where in the process someone actually is.
Why two separate employee tracks?
FTEs and contractors have different legal requirements, access levels, and timelines. Trying to combine them into one flow created too many conditional branches that would break under edge cases.
Why a diagram instead of a written SOP?
A written SOP hides the structure. You can't see the parallel tracks, the decision points, or where one department's step unlocks another's. The diagram makes the dependency logic visible at a glance.

04 IT Access Provisioning System

When I joined, access was being managed through Slack threads and informal requests. I replaced it with a documented workflow covering the full access lifecycle: provisioning, role changes, and offboarding. Every request defaults to least privilege with an audit trail at every step.

Access management at an early startup tends to start off as informal. New joiners send out a Slack message asking for additional access if they think it would help. The issue isn't whether the request is valid. There's no audit trail, no consistency, and no process for removing that access when someone changes roles or leaves. I built this workflow because access levels can be a major security risk and informal Slack threads or DMs weren't a good enough system for managing it. Every request was documented, every change was tracked, and evidence was captured at every step.

What this covers
  • Day-1 Provisioning. Role-based access package assigned before the start date, with least-privilege defaults so there's no manual triage on day 1.
  • Role Changes. Triggered on promotion, transfer, or scope change. Stale access is removed and the new role's package is provisioned within one business day, with a documented audit trail.
  • Offboarding. Revokes all access on the employee's last active day. A log entry is written capturing the accounts closed, timestamp, and who executed the change.
How it ran in practice

Isara was handling sensitive AI research that wasn't public, which made access control more than a procedural nicety. The workflow ran on 5+ new hires and covered 3+ offboardings. Every event generated a log entry capturing what changed, when, and who executed it, so there was always a clear record of who had access to what and when that changed.

05 Vendor & Contractor Tracker

After I joined, we quickly expanded our vendor sprawl and needed clarity on what we were paying for and when contracts neared expiration. I built a centralized vendor tracker and automated alert system for contracts needing renewal.

At a fast-growing startup, tools get purchased by different people across different teams and service contracts pile up fast. This tracker captures every vendor and contractor: who owns the relationship, what it costs, whether it's active, and when it's up for renewal.

Outcome

Built a single tracker to manage 30+ vendors and contractors. It was designed to be lightweight enough that common vendor questions could be answered without a system login or a request to finance.

Structural decisions
  • One row per vendor relationship. Structured this way so the full picture of each relationship stays in one place rather than split across multiple contract rows.
  • Renewal dates are the primary sort key. The most urgent items are listed at the top so they don't get buried in an alphabetical list.
  • Spend is directional. Actuals live in Ramp. The tracker holds the budget and flags material variance.
  • Fixed status vocabulary. Active, Expiring, Expired, Under Review. Keeps filtering consistent and prevents the values from drifting as more people use it.
  • Vendor contacts are on the record. If I'm not around, anyone on the team can reach a vendor directly without having to track me down first.
InformationBest home
Contract status + renewal datesVendor Tracker
Spend per vendor (actuals)Ramp / accounting
Point of contactVendor Tracker
NDA + compliance statusVendor Tracker
Tool category / business ownerVendor Tracker
Vendor tier + criticalityVendor Tracker
Contract documentsGoogle Drive
Legal review statusVendor Tracker
Renewal alert automation

The first alerts fired on short-term contractor contracts. I built this to catch renewals automatically rather than tracking dates manually, and to have the system in place before longer vendor cycles came due. It runs on a daily trigger in Power Automate and emails me when any vendor is 90, 60, or 30 days out from renewal. Each threshold fires once and writes back to the LastAlerted column so it doesn't repeat.

VendorRenewalAlert.flow + View flow
// ─────────────────────────────────────────────────────────────
// Vendor Renewal Alert - Power Automate
// Scheduled daily. Reads vendor tracker from SharePoint Excel.
// Sends Outlook email at 90 / 60 / 30-day thresholds.
// Each threshold fires once per vendor.
// Requires: Vendors table with VendorID key column;
//           RenewalDate formatted as date in Excel;
//           LastAlerted as number (blank = no alert sent yet)
// Note: Concurrency Control must be OFF on Apply to each —
//       daysOut/lastAlerted/threshold are shared variables
// ─────────────────────────────────────────────────────────────

TRIGGER - Recurrence
  Frequency : Day
  Interval  : 1
  Start time: '08:00 AM'

// ── INITIALIZE VARIABLES ─────────────────────────────────────

ACTION - Initialize variable  AlertRows   (Array,   [])
ACTION - Initialize variable  daysOut     (Integer, 0)
ACTION - Initialize variable  lastAlerted (Integer, 0)
ACTION - Initialize variable  threshold   (Integer, 0)

// ── GET DATA ─────────────────────────────────────────────────

ACTION - List rows present in a table
  Site    : 'https://company.sharepoint.com/sites/Ops'
  Library : 'Documents'
  File    : '/Trackers/VendorTracker.xlsx'
  Table   : 'Vendors'

// ── PROCESS EACH ROW ─────────────────────────────────────────

ACTION - Apply to each  (input: List rows output — Concurrency Control: OFF)

  // Skip rows with no renewal date
  CONDITION - not(empty(item()?['RenewalDate']))

    // Days until renewal — formatDateTime ensures consistent ISO input to ticks()
    ACTION - Set variable daysOut
    daysOut = div(
      sub(
        ticks(formatDateTime(item()?['RenewalDate'], 'yyyy-MM-ddTHH:mm:ssZ')),
        ticks(utcNow())
      ),
      864000000000
    )

    // Skip vendors that have already expired
    CONDITION - greater(variables('daysOut'), 0)

      // Treat blank LastAlerted as 999 (no alert sent yet)
      ACTION - Set variable lastAlerted
      lastAlerted = if(empty(item()?['LastAlerted']), 999,
                       int(item()?['LastAlerted']))

      // Resolve threshold - tightest one not yet sent (0 = no alert due)
      ACTION - Set variable threshold
      threshold = if(and(lessOrEquals(variables('daysOut'), 30), greater(variables('lastAlerted'), 30)), 30,
                  if(and(lessOrEquals(variables('daysOut'), 60), greater(variables('lastAlerted'), 60)), 60,
                  if(and(lessOrEquals(variables('daysOut'), 90), greater(variables('lastAlerted'), 90)), 90,
                  0)))

      CONDITION - greater(variables('threshold'), 0)

        // Add vendor to alert list
        ACTION - Append to variable AlertRows
          {
            "vendor"  : "@{item()?['Vendor']}",
            "renewal" : "@{item()?['RenewalDate']}",
            "daysOut" : "@{variables('daysOut')}",
            "contact" : "@{item()?['Contact']}"
          }

        // Prevent threshold from re-firing — VendorID identifies the row
        ACTION - Update a row
          Key Column  : VendorID
          Key Value   : "@{item()?['VendorID']}"
          LastAlerted : "@{variables('threshold')}"

// ── SEND EMAIL ───────────────────────────────────────────────

CONDITION - greater(length(variables('AlertRows')), 0)

  ACTION - Send an email (Outlook)
    To      : 'courtney@company.co'
    Subject : '[Vendor Tracker] @{length(variables('AlertRows'))} renewal(s) need attention'
    Body    : <HTML table of vendor, renewal date, days out, contact>

06 Headcount Tracker

Headcount is an input to cost planning, board reporting, and payroll. I built one tracker to keep all the information in sync.

Headcount is the input to nearly every financial planning conversation: budget forecasts, compensation modeling, board reporting, and payroll all start from the same question of who is on the team and in what capacity. Before this existed, there was no central record.

Change log: Google Apps Script

An onEdit trigger runs automatically on every cell edit and appends a row to the Change Log tab with the timestamp, user, sheet, cell reference, and old and new values. The KPIs and Change Log tabs are excluded so the log doesn't record its own writes.

const IGNORED_SHEETS = ['Change Log', 'KPIs'];
const LOG_SHEET = 'Change Log';

function onEdit(e) {
  if (!e || !e.range) return;

  const sheet     = e.range.getSheet();
  const sheetName = sheet.getName();
  if (IGNORED_SHEETS.includes(sheetName)) return;

  const ss = e.source;
  let logSheet = ss.getSheetByName(LOG_SHEET);
  if (!logSheet) {
    logSheet = ss.insertSheet(LOG_SHEET);
    logSheet.appendRow(['Timestamp', 'Changed By', 'Sheet', 'Cell', 'Previous Value', 'New Value']);
    logSheet.getRange(1, 1, 1, 6).setFontWeight('bold');
  }

  logSheet.appendRow([
    new Date(),
    Session.getActiveUser().getEmail(),
    sheetName,
    e.range.getA1Notation(),
    e.oldValue ?? '',
    e.value ?? '',
  ]);
}
Design decisions
  • Jurisdiction-aware from day 1. We had a US office, a UK office, and international hires on an employer of record (EOR), each running on a separate payroll system with different benefits and employment law. Segmenting from the start meant reporting was accurate without extra cleanup.
  • Built for an exec audience. The KPI tab has no visible formulas, consistent number formatting, and is sized to paste directly into a board deck without reformatting.
  • Change log built in. Every structural change is timestamped with the person who made it, which came up regularly as part of due diligence.
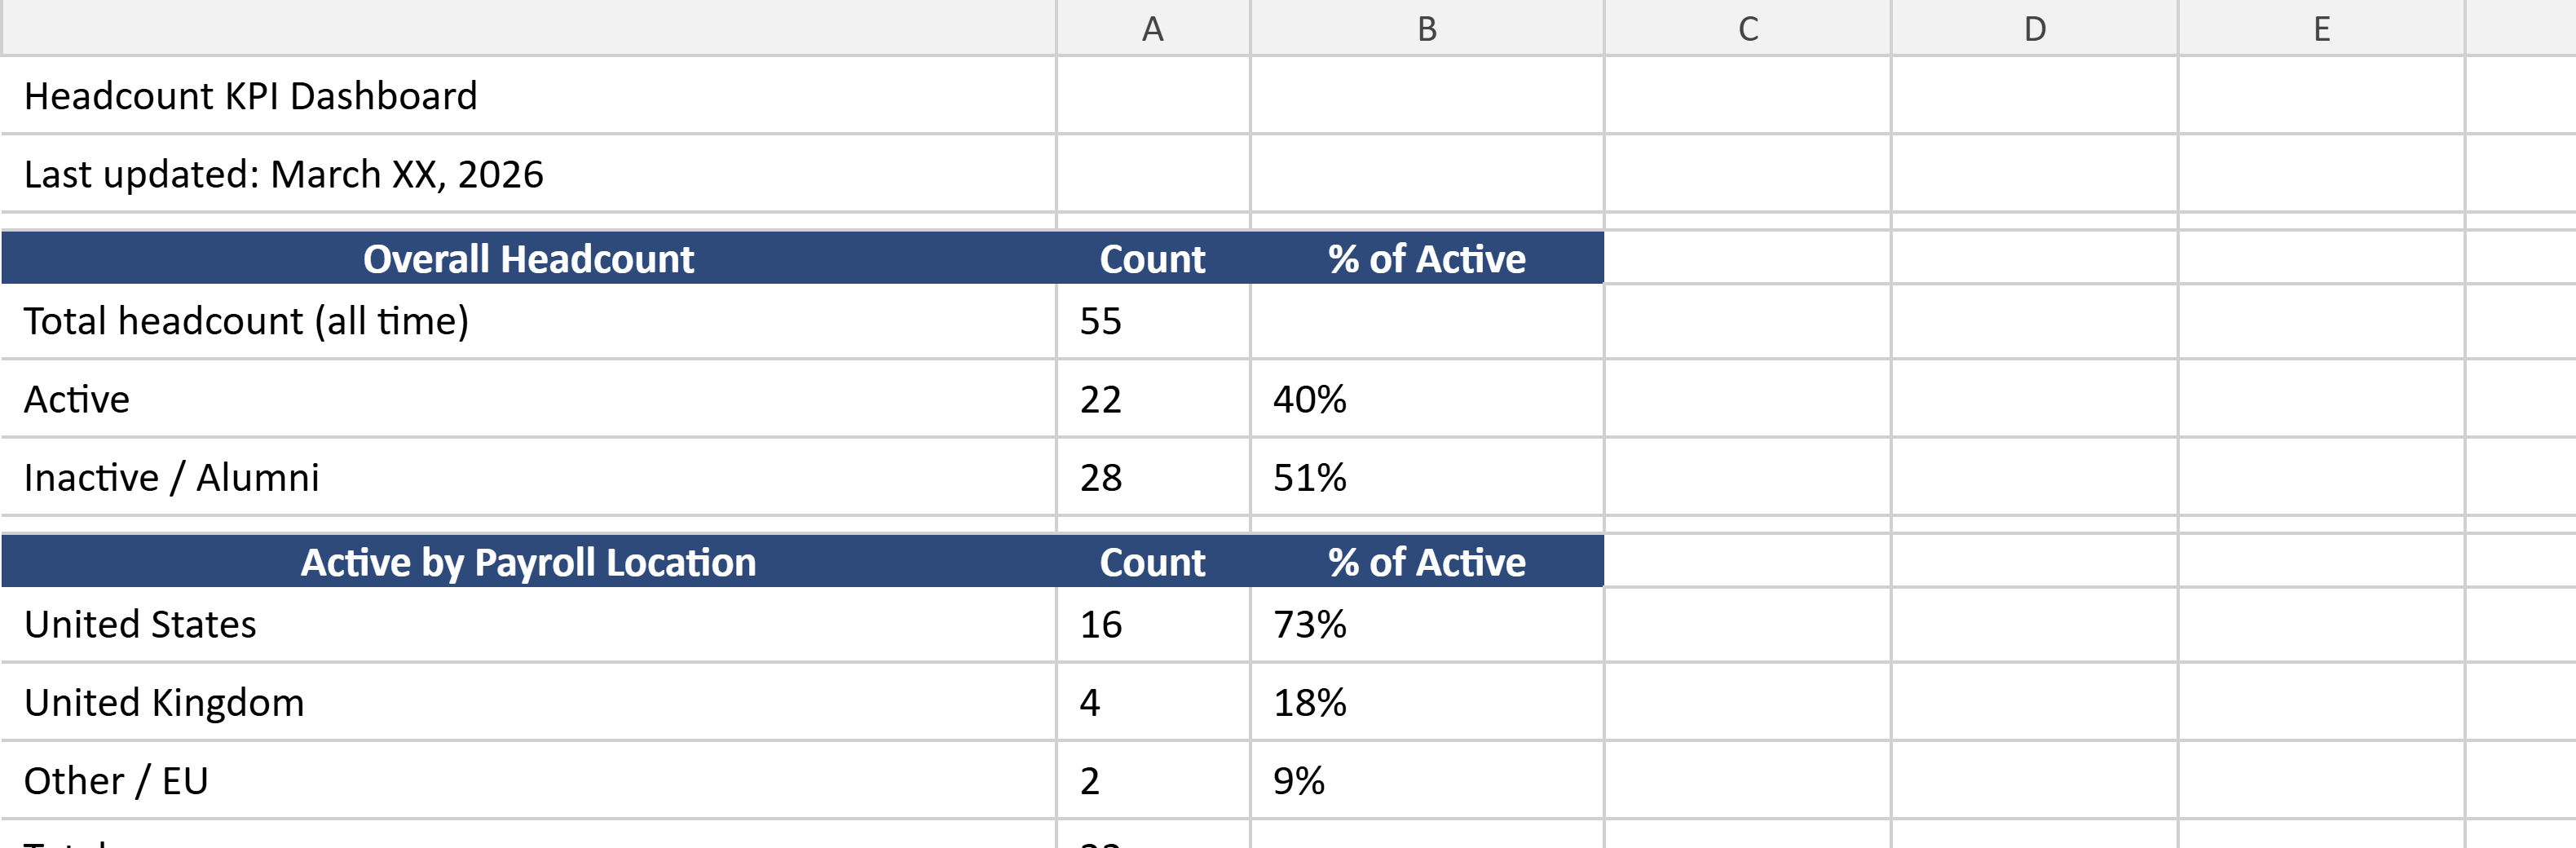
Headcount KPI dashboard
KPI tab, formatted for board reporting, no visible formulas
How to read it
  • KPIs. Dashboard summary: total headcount, active/inactive split, payroll location breakdown (US, UK, EU), employment type mix, and invoice status. Formatted for board reporting.
  • Headcount. Full employee roster, active and inactive. One row per person. Tracks NXR ID, name, role, employment type, status, location, payroll method, compensation, manager, and notes.
  • Consultants. Consultant engagement log. Tracks contract start/end dates, hourly rate, total hours billed, and engagement status.
  • Invoice Tracker. Invoice history for all consultant payments. Tracks amount, submission date, approval status, and payment status.
  • EOR. International workers engaged via Employer of Record (Playroll or GX). Tracks country, provider, monthly employer cost, and onboarding status.
  • US HR Contracts. Executed employment agreements for US-based headcount. Tracks contract type, effective date, and signature status.
  • UK Contracts. Executed employment agreements for UK-based headcount. Tracks contract type, effective date, and signature status.
  • Change Log. Timestamped audit trail of every edit: who changed what, on which tab, and when.

07 Equity Grant Tracker

Grants move through board approval, Carta, and a signed letter to the employee. If any step stalls or gets skipped, vesting doesn't start on time. I built this tracker so nothing gets missed.

Grants had been promised in offer letters but there was no central record of where each one was in the approval and issuance process. This tracker manages the full lifecycle from board approval through grant letter delivery, and gives finance a reliable view of the cap table without depending entirely on Carta for every question.

Design decisions
  • All 3 jurisdictions in one workbook. Grants work differently by jurisdiction, so entity type is a required field and filters handle the segmentation.
  • Stale approvals flagged automatically. Conditional formatting highlights grants pending more than 30 days.
  • Cliff and acceleration events in notes. A place to capture verbal agreements before they show up in formal documentation, so nothing is lost between the conversation and the signed letter.
  • Vesting tracked at the grant level. Routine cap table questions could be answered without logging into Carta.
How to read it
  • Each row is one grant event. Someone with multiple grants appears multiple times, which makes the lifecycle visible chronologically and prevents grants from being collapsed into a single number.
  • Approval status has a timestamp and the approver's name. Grants pending for more than 30 days get flagged, which caught a few cases where something was verbally approved but never formally signed.
Why this matters at the early stage
Common problems
  • Verbal approvals never formally documented
  • Stale grants sitting in board queue unnoticed
  • Grants across jurisdictions tracked inconsistently
  • Vesting details scattered across offer letters
How this solves them
  • Approval timestamp + approver captured per grant
  • 30-day flag surfaces pending grants automatically
  • Single workbook with entity type as required field
  • Vesting tracked at grant level with notes field
Get in touch

Contact